

Forecasting needs for space, SKU counts and otherwise daily management of inventory is never a simple task. While the front office staff who design and create new products, forecast the sales and order the inventory for the coming season or sales cycle may have years of experience and a portfolio of modern tools to work with (i.e. software), the team running the distribution center generally is less well-equipped to deal with the operational aspect of those elements in a predictive and flexible manner.
In their annual benchmark study on forecasting and inventory management, E2Open shares some eye-opening statistics that they’ve tracked annually since their first survey in 2010:
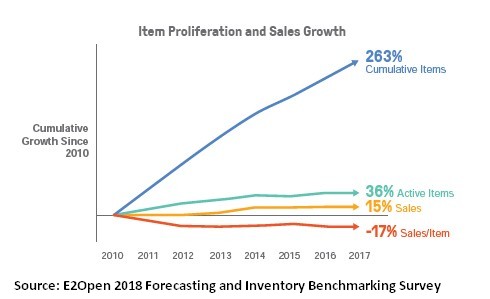
- 94% of new products end up in the “slowest moving items” column within 12 months
- Total “active items” in that period grew at twice the rate of sales (36% vs. 15%).
- Sales per item has dropped 17%
This is presented in the survey as “the cost of innovation”, which in one way, it is. It is also the “cost of growth and remaining competitive”, because for a successful business growing with an expanding base of happy customers often requires expanding with their tastes and the preferences of new audience segments as you grow.
How do successful businesses account for this and manage it successfully?
It’s the 80/20 Rule Again, But Not Quite
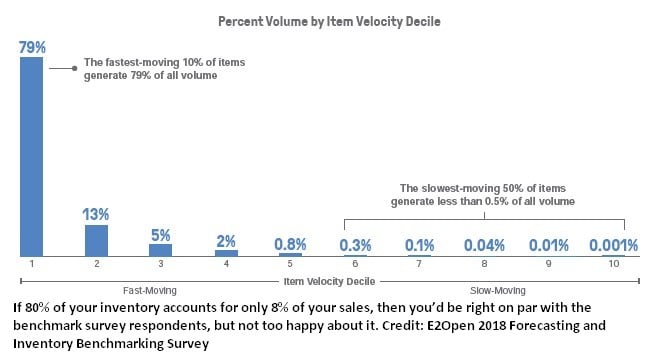
First, it’s important to understand the concept of the “long tail”, which can be loosely defined as the large portion of slow-moving items that account for a disproportionately small volume of sales. In the annual study, this is measured by dividing ALL of the items into deciles (10% of the total) and reflect the sales volume for each decile to see where the “long tail” starts.
In the responses to the study below, the top 10% (the fastest-moving items) accounted for a whopping 79% of sales, while the bottom 50% represent less than 0.5%. Even moving up the chain to include the bottom 80% accounts for only 8% of sales! The amazing insight here – that 80% of your inventory might cost more to store and transport it than you would make from selling it.
The Problems With This Are Many
The study is a great resource to use as a comparison to your own internal analysis, as well a an excellent educational tool to better understand the various KPIs and levers at your disposal with which you can manage through these issues and make improvements.
Here is a quick list of red flags and issues you should consider monitoring as a checklist to improve your product development and production processes.
What the study doesn’t cover in detail, but is fairly obvious, is that the inefficiency of this “long tail” you have increases your costs in total space needed, labor hours, extra touches, etc. You might have a top-notch DC team that makes all of it look pristine and moves it where it needs to go as efficiently as possible, but if a large percentage of it shouldn’t be there in the first place, it’s effort not well utilized.
Just How Are We Supposed to Make Improvements?
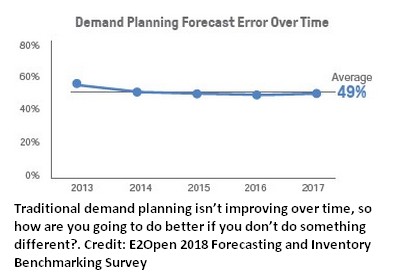
If there is one thing that is clear from the study, is that if you’ve not made the effort to learn about and implement some more advanced ways to forecast demand and manage your inventory, then you’re not going to see more than incremental changes at best.
Here are a few areas worth exploring that should make a difference (though admittedly some of them will take a year or two to really make an impact):
- Get your KPIs in order – it would be easy to say “get rid of the bottom xx% of your losing items”, but it’s not always that easy. Slow-movers are not bad if they are important to long-term or loyal customers, or if you are forecasting accurately. Having a consistent and accurate way to assign costs to your items in regards to their storage (and any moving around while there are there) is an important extension beyond just the standard COGs and sales calculations. Then using some, if not all, of the KPIs in the study will provide a great way to benchmark yourself against your peers, though the industry you belong to will account for some differences.
- Modernize your Demand Planning – as the study shows, traditional demand planning is stuck, without any real opportunity to improve given its current parameters. “Demand Sensing”, which is a more nuanced technique that forecasts near-term “daily demand across a horizon of several weeks”, taking into current information on inventory, shipments, open orders, customer behavior along with any other causal factors that may impact demand.
- Create a Predictive Model – there is a marriage of Marketing and Demand Planning that is often overlooked. Creating a “next logical product” model would let you better choose not only which products will earn their keep, but when to expect the demand. Simply put, your customers will tend to buy your products in a specific order over time. Think of a first-time woodworker who buys a few basic tools when they start out, then over time add to their collection as their skill level improves. This is a great way to help point the way to a better forecast within your long tail.
- Have a “Product Exit Strategy” – not to contravene the first bullet, but when a product is not moving, nor does it matter to customer loyalty, it’s time to make the hard decision to cut your losses and slim down the SKU count. But doing it intelligently matters. A case study from a British supermarket in the 90’s is a great example. Faced with the need to reduce the variety of cheeses from over 300, the immediate instinct was to cut out the slowest movers. But when they dug deeper they found that many of those cheeses were rare and when purchased, were often purchased along with some of the most expensive wines and other gourmet foods. Using customer behavior as a context for your analysis makes these hard choices much easier.
This is actually one of the hardest aspects of managing the business, and while the variables are almost the same for any business, their impact can vary wildly depending on the industry, or if you are doing a direct-to-consumer or warehouse-to-retail business model, where forecasting models are very different and have different factors impacting effectiveness.

To Learn More:
See our earlier article on the “7 Best Practices for Inventory Management for Warehouses” and for your own copy of the E2Open study, go here to download it from SupplyChain247.