
 Unless your facility is consistently recognized as a bleeding edge innovator and always staying two steps ahead of the rest of your industry, you’re probably like the rest of us and are hungry to know more about how your facility performs or compares to your competitors or others in your industry.
I once had the tremendous joy of leaving an employer I loved for another career, where a former competitor was not a client. The joy was not in leaving of course, but in what I learned from my former competitor, who showed me a survey they had done in the industry to measure customer satisfaction and performance in eight categories. Among a dozen or so leaders in the industry, my former operation was ranked #1 in SEVEN of the categories and second in the eighth. I could think of no higher compliment - or addition to my resume – than the copy of that report they provided me!
So how is your facility performing relative to others? Getting specific KPIs on productivity are not the kind of thing a survey will capture accurately, if at all, as revealing that kind of data is generally frowned upon by just about anyone, but there are other ways to look across the industry and compare the dynamics that impact you and how they impact others. Late last year Logistics Management and Modern Materials Handling published an evaluation they did on “Warehouse Operations & Trends” where they looked at the following areas of investigation:
- Nature of distribution center’s operations
- Size of distribution center and scope of distribution activities
- Areas for possible expansion
- Distribution center systems and technologies in use
- Means for measuring productivity
- Actions taken to manage warehouse operating costs
- Events that cause disruptions in distribution center operations
We’re going to use this space for a few weeks to look at some of the main findings that we thought might be the most relevant or deserve a closer look or discussion. This week we’re going to dive in to “Space and Congestion”.
Space & Congestion
One VERY consistent area where our own annual survey always indicates a lot of challenges for our customers is in space management. As in “Never have enough space”. This is a factor of both normal expansion over a decade of economic growth and in some part an issue of how to utilize space better as processes and business models evolve. This survey has a some interesting insights to highlight:
Question: Which area in your warehouse is the most congested in terms of square footage (space)?
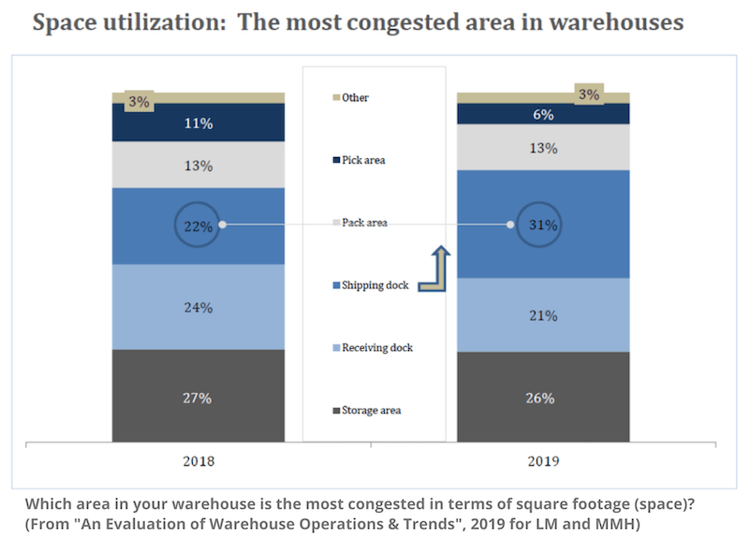
As highlighted in the chart above, the big change was reflected in the Packing Area, with 31% naming it their “most congested” versus “storage” in 2018 with 27%. This could be a result of a number of things, including, but not limited to, 1) Improved space usage of OTHER areas like Picking, where automation is beginning to speed things up and generate more productive and accurate processes or 2) Higher speed in other areas that Packing has not caught up with the pace yet. If a pick wave generated 600 items picked per hour by a single person in 2018 but went up to 700 in 2019, this would put pressure on Packing and create congestion if it was not planned to account for the improved productivity.
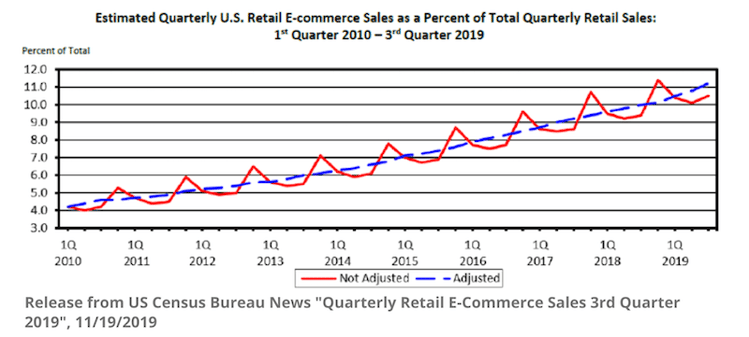
Or what we would postulate as the likely culprit – eCommerce. According to the US Department of Commerce data, eCommerce for 2019 Q3 grew about 17% versus Q3 of 2018, while retail sales grew by only 4%. What does that mean? It means that warehouses that have been re-designed to accommodate both retail distribution AND direct to customer shipping are increasing the number of unique shipments massively as eCommerce grows. Retail growth tends to result in packing more PALLETS for retail stores, while eCommerce translates into cartons going directly to customers. With 9,3000 retail stores closing in 2019 (59% increase from 2018), that’s a large loss of destinations for pallets. But a store closure can be a result of lack of foot traffic, or a business model change, not necessarily a lack of demand.
To illustrate this, we can look at a retail brand like “Kitchen Collection”, who closed all 160 stores at the end of 2019. A manufacturer or distributor supplying those stores would normally be sending pallets to supply them at their warehouses (or perhaps the stores directly). But customers looking for the kitchen manufacturer brands aren’t going away – and judging by the forecasted average annual growth of 6% for kitchen cabinets, they will be looking for things to put in them! Those same brands at Kitchen Collection now need adapt their supply chain to serve those customers. That could mean improving their use and management of their 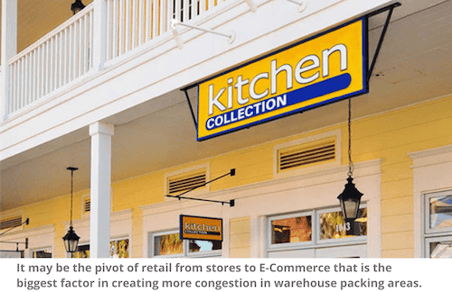 Amazon marketplace store, paying more in trade fees to other retailers still operating brick & mortar or ramping up their own direct-to-consumer operations to cut out the middleman and create their own customer relationships. Selling 6,000 12-piece cookware sets through your retail distribution might mean 2-600 pallets being packed a year, but if those need to go directly to the customer then it becomes a much bigger operation to turn that into 6,000 unique shipments spread out over all of your open days and will require a rethink of your space allocation in your warehouse.
The other main question from the survey that is relevant here is about peak season space:
Question: In the past five years, have you leased additional/outside space during peak season?
“Peak season” is given that moniker because on average, the US retail market does about 60% of its sales in the last four months of the year. For eCommerce 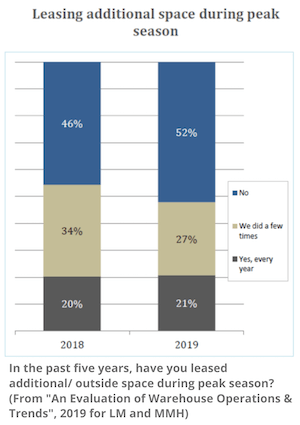 or Catalog businesses that are popular Brands during the Christmas giving season, the last two months of the year can be truly harrowing (or perhaps “exhilarating”!) in terms of the net change in volumes. It is not uncommon for warehouse to add temporary space – if they can find it.
In the survey, 21% responded that they lease additional space EVERY year (for the last five years), while another 27% indicated they did more than once over that time period. However, with that number declining from 34% in 2018, this could be an indication of facilities getting a better handle on things and no longer needing the extra space because they’ve added it permanently or have re-designed their space to better accommodate the changes in how the business operates.
The other smaller possibility is that the decline in this number indicates a potentially slower economy (or slower for the survey respondents), but this is less likely unless is appears to be a consistent trend over time.
The Lesson for Facility Managers
Even not too long ago there were many in the industry not wanting to believe what the US Commerce Data has been showing us for two decades – eCommerce will continue to rise steadily over time and we don’t know where the plateau is yet.
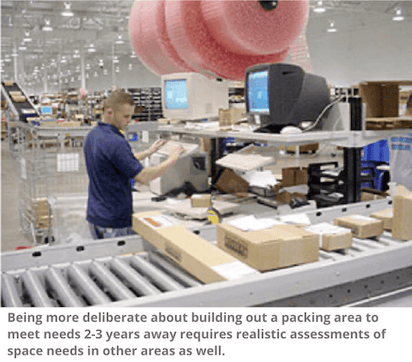 As the data here may be showing us, facility managers planning ahead need to think about how to make their existing spaces more flexible in how they are used. If the packing space is congested year-round look at your data over previous years to see if it is only going to get worse and plan for accommodating that 2-3 years out. Adjusting schedules in software for using the space for pallets during one part of the day and individual cartons another time of day (usually tied to the “last call” for shippers like UPS/Fedex).
Shrinking other spaces – like reserve inventory – is possible if you are making progress on increasing turns. And if you do need to lease additional space every year anyway, rethink your current MAIN space to give more room for the added-value operations and move some of your main storage to the additional facility.
Next week: Use of Warehouse Management Systems and other software/technologies
The fourteenth annual “Evaluation of Warehouse Operations & Trends” survey was administered via email invitation to subscribers of Logistics Management magazine. Respondents were qualified for being involved in decisions as they pertain to their company’s distribution center operations. See a full copy here.