

The annual DC Metrics study has been published and while the entirety of the report is worth studying as an excellent source of industry benchmarks and trends, we wanted to share and dive into a few of the highlights that jumped out at us as significant this year.
With metrics being a perennial focal point, we’ll go into some of the way everyone values which metrics and what is changing over time. We’ll also look at both the digital and analog technologies being deployed the most and then share a bit of analysis on a potential correlation between industry and picking methodology.
The annual report is produced through a partnership between the Warehousing Education and Research Council (WERC) and DC Velocity. This year’s survey was conducted by Joe Tillman, a WERC researcher and founder of TSquared Logistics, and Drs. Donnie Williams and Karl Manrodt of Georgia College & State University.
Metrics on the Move
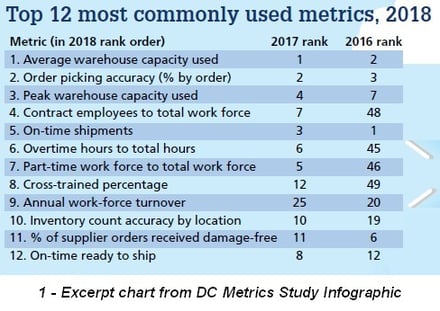
Not to sound like a pun, but one key metric for tracking industry trends is the value placed on metrics year-to-year and how they rise and fall in popularity. The DC Metrics study highlights the top twelve for 2018, here is what is interesting about this year’s rank order:
1. FIVE of the Top 12 are Labor Focused Metrics – This might just be the most interesting part of the entire study this year. In 2016, NONE of the five ranked above #20. What is driving this focus that was essentially non-existent only a few years ago that now has them with an average ranking at #7? There is likely a strong correlation with labor shortages and low pay that have made it harder for employers to keep trained staff. But could also come from the need to improve training to better utilize the technologies being implemented (often in part as a way to make up for the labor shortage!).

 2. Space is On Everyone’s Mind – space utilization is yet another rising metric that is on everyone’s mind. After displacing “On-Time Shipments” as the perennial top-tracked metric in 2017, “Average warehouse capacity used” is number one again. This actually matches our own data from our annual customer survey. We’ve seen that everyone is looking for ways to improve and grow WITHOUT using the addition of more space as a lever for doing so. Again, technology and labor might be driving this. Technology creates more opportunities to use the same space more efficiently (rack optimization software) and improve productivity with the same or lower number of man hours.
3. “On-Time Shipments” - dropped from its perennial #1 spot in 2016 to #3 in 2017 and #5 this year. In some way, this is not surprising. The model Amazon has created in partnership with UPS, FedEx and USPS has equipped them to provide those same services to everyone. Being “on-time” is not the challenge it used to be, and it would not be surprising to see this metric fall out of the top ranking altogether in 2-3 years.
The Technologies Everyone Wants
The technologies stats are divided by high-level “technology” that includes software like WMS and TMS applications along with equipment like conveyors and tech-driven process upgrades like pick-to-light and voice collection and “digital technology” which spans everything from truly digital solutions in social media and cloud applications to equipment which is digitally driven like 3D Printing and Robotics. The difference in the reporting of the latter is more about “intent” than current use, capturing timelines for intended implementation rather than comparing existing use with prior years.
Technology Implementation 2018 vs. 2008
Concerned with Labor, or not? The first item that jumps out is one that seems at odds with the prevalence of concern over labor metrics we referred to earlier. Labor management system (LMS) adoption creeped along at only 4% growth per year. We’ve seen that the labor shortage has created more interest in measuring it than ever, but have to wonder if the relative lack of interest in LMS applications, along with stagnant wages indicates an unwillingness to accept a new reality about staffing.
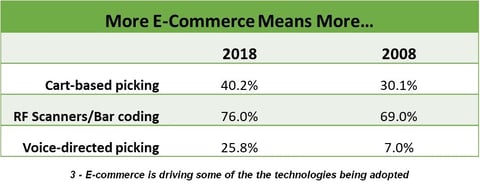 The E-Commerce factor – There are three seemingly unrelated additional statistics here whose growth is most likely a result of the continued explosion of E-commerce sales and the greater percentage of businesses shipping directly to customers. Cart-based picking and voice collection are made for each other, especially in distribution centers implementing direct-to-consumer shipping for the first time and without any legacy processes that would slow their adoption of the technology. Barcoding is called out here not for the large increase, but to highlight that it is still a growth area at all, as we are often under the impression that the technology is already ubiquitous and saturated when in fact, it is not.
Some Have Fizzled - Surprisingly, some technologies have DECLINED over 10 years, such as Carousels and Advanced Shipping Notification systems. Other technologies, like “pick to light” had statistically zero growth over the same period (11% ->12%).
Technology Implementation Intentions
For the data under the “digital” category, our interest is less about the current adoption rates, but the intended adoption rates, especially in the near term, along with the total intended adoption over the complete 5-10-year timeframe. We dug into the data a bit and asked two questions:
- What percent of those surveyed intend to adopt the technology at any time in the future?
- Which technology might see the largest potential growth?
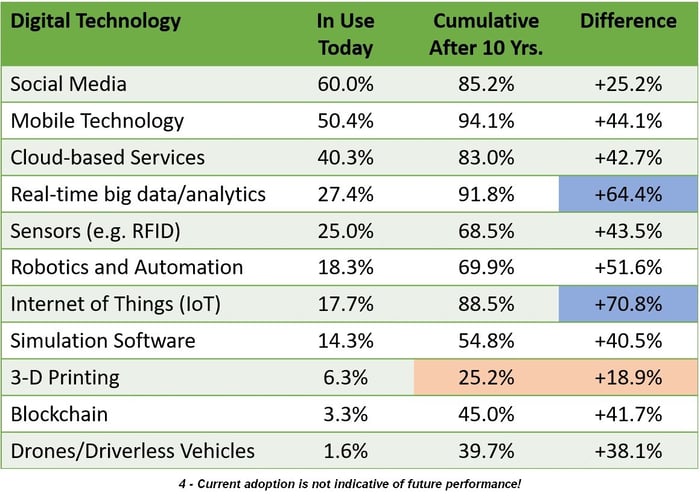
The current adoption rates show that social media and mobile technology exceed 50% adoption rates already, while cloud-based services just break 40%. Everything else is near 25% or well below. When we look at the data over time however, we can see that “Big Data/Analytics” and the “Internet of Things” have the biggest potential long-term upside based on intentions. 3-D printing, on the other hand, starts low (6.3%) and doesn’t seem to have captured imaginations even 10 years out, peaking at 25.2%. What does this imply?
Real-time Big Data/Analytics – With 42.7% of respondents indicating they plan to “use” in the next 1-2 years, Data/Analytics shows the most near-term interest of any technology. However, it’s good to remember that companies without much expertise and experience in “Analytics” are not going to be jumping into “Big Data” unless they are investing heavily in outside resources and expertise. This is really a two-part question where some respondents are focused on the “Big Data”, and others the humbler “Analytics”. Our experience tells us that this will be a divide between larger and smaller companies. For those not already deep into the Analytics space, getting the basics right before running with the “Big Data” crowd is recommended. In other words, getting some basic KPIs right first is what will matter for these businesses.
Internet of Things (IoT) – This is a more natural area to expand in for nearly any business. We’ve heard more frequently recently about ideas to connect our own carts to the network, so they can be tracked and have their power levels monitored. With the speed and capacity of modern networks, along with the capabilities to track all kinds of transactions and organize them to view the activity in the business in many ways never previously possible. Forecasters predict that there will be over 21 Billion devices connected to the internet by 2020 – this includes almost any electronic device you use to run your operations – printers, scanners, even equipment like conveyors, aisle pickers, etc.
Your Customer Determines Your Order Picking Method?
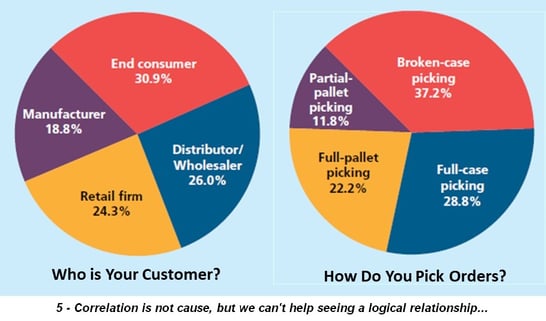 Finally, we noticed a potentially interesting correlation between two of the charts in the report. Take a look at both of them and see if you see what we do:
If we start with the “Picking” chart, we see “Broken-case” picking topping the list at 37.2% for the first time. As the growth in E-commerce would suggest, this is not entirely surprising as direct-to-consumer is almost always going to be broken-case picking. While the numbers and even the color match for this example, there are other logical correlations too – i.e. picking for a Distributor/Wholesaler customer will almost always involve full pallets. Shipping to retail customers involves a mix – with full cases along with partial pallets and broken-case picking (i.e. re-usable totes shipped with mixed product for replenishing shelves.).
While these two charts are merely suggestive of a correlation, it does help to provide some insight into what kind of picking processes are required to serve specific types of customers.
What about your facility?
What insights did you find in this year’s report? Let us know if you had an “Aha!” moments or if it inspired some questions about your own business we can help you with.
See the complete DC Velocity Infographic here.