With the holiday season in the rear-view mirror, there are a lot of messy warehouses out there digesting the aftermath of a contradictory set of challenges – depleted shelves, piles of returns, overstock on unpopular items and excess capacity. If you’re like most retailers – or manufacturers who are new to the E-commerce game in the last few years – then you are probably wondering how you ended up with so much overstock for some categories of your product, right?
Having everything for everyone every time they want it seems like a safe bet if you are trying to grow your business and keep customers happy. But in the long run, seeing excess inventory as a “safe” way to conduct business is a drag on your business, in more ways than one.
But First, How are We Doing?
As with all potential process improvements, before deciding if you should be doing things differently, you need to know how you are doing. The most common measure of some kind of efficiency in your inventory management is “Inventory Turnover”, as in “How many turns do you get/have?”
How do you calculate your turnover? Here is a simple formula:
Inventory Turnover Ratio = (Cost of Goods Sold)/(Average Inventory)
For retailers, “Cost of Goods Sold” (COGS) is the actual cost paid for the products acquired plus the shipping cost to get them delivered to your facility. For manufacturers, it would be the cost of the raw materials (delivered) along with the labor and other overhead involved in the manufacturing of the product.
“Average Inventory” is simply a matter of taking the combined inventory balance at both the beginning and end of the fiscal year and dividing the resulting number in half. For example, if the year started with $35MM of inventory and ended with $42MM, then the “Avg. Inventory” would be (35+42)/2 = $38.5MM.
So, let’s say a catalog retailer with a single warehouse has the Average Inventory of $38.5MM and does $320MM of sales per year with a Gross Margin of 60% (which then assumes a COGS of $128MM, then their Inventory turns would be:
$128MM/$38.5MM = 3.32 Turns
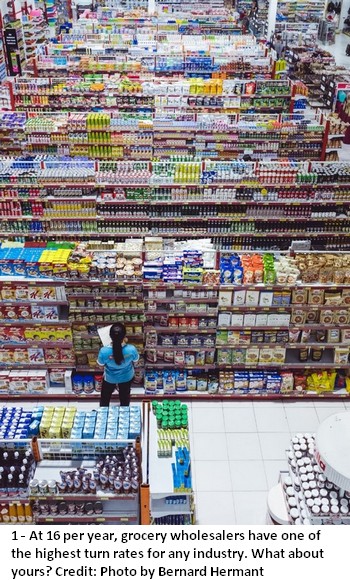
So, a bit over 3.3 “turns” per year. Is that a good number? Probably not. Twenty years ago, getting to 4-5 turns a year would be seen as a major accomplishment for a typical catalog company. But the world has changed a lot since then, and depending on your industry, it could be a bit higher (furniture, home goods, apparel, etc. tend to average around 5) or much higher (Paper products at 10+, grocery wholesale at 15-16)!
How about your business? Do you track this KPI?
Sorry, You’re Too Emotional To Manage Inventory
An October 2018 article in Logistics Management had a very good in-depth look at some of the typical issues with sound Inventory Management practices. The key issue, as stated in the article, is that excess inventory is FAR more common than lack of it, and most of the time this stems from the emotional need for the security blanket that excess inventory provides for many businesses.
The article leads with a quote from Ian Hobkirk, president at Boston-based Commonwealth Supply Chain Advisors. “We can show them, mathematically and six ways to Sunday, how to reduce those inventory levels, what the stocking levels should be for each SKU, and so forth. However, at the end of the day inventory is a security blanket that’s largely rooted in emotional decisions—logic just doesn’t apply.”
Getting a grip on your inventory management can come from a number of different solutions, we’ll look at a few of them here today:
- Forecasting
- Software
- Returns Processing
- RFID and other automation
Forecasting
Why are we calling out forecasting here separately from Software? Well, because it can actually be done manually. Crude, yes, but if you’re a smaller operation with some basic data available to you, you can do a better job forecasting with some intermediate spreadsheet skills.
To get started here, it’s best to pull together data like previous sales history, sales and demand trends, the average lead times to receive new inventory, and any seasonal factors that are relevant for some SKUs. This will help you do a forecast and also help you set a reliable to reorder point for each of your products.
If you are in a business where products change by season, then your sales data from previous years should generate a curve showing the spike and decline in demand over time. So, if we use a 16-week model (about four months, which covers a season and some overlap on each end), you would map out your previous year’s sales by week, then adjust accordingly based on your expected change for the coming year. When the products are on sale, add a column to your chart with the ACTUAL sales, and then project the percentage difference out for the remaining weeks to help you anticipate if you need to order more inventory, plan to promote products that are falling behind, or hold the line where you are. The chart will differ for every product of course, and a variety of factors will impact it differently year to year depending on how you are marketing, how the economy is moving, and consumer trends for those products.
Sound complicated? It is, perhaps, if you have thousands of SKUs, but getting a template together isn’t that hard once you create the model for the first SKU and set up an easy way to import your data.
And yes, there is software that will do this for you, read on.
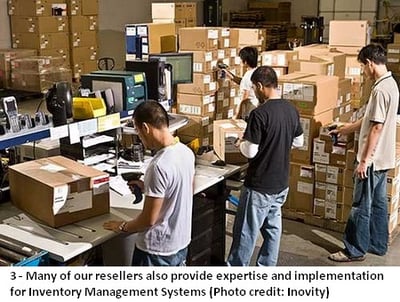
Software
Inventory Management software applications will generally be comprised of a centralized database, analytical functions, documentation, labeling, and the reporting procedures needed to create an end-to-end management system (i.e. like just in time [JIT] or first-in/first-out [FIFO]). It will be compatible with your hardware platform – the scanners and mobile apps in place that do your scanning.
As the article in Logistics Management correctly notes, software is the best bet to remove the emotional component from inventory management, which inevitably leads to overstock. A typical CEO will find the pleas of marketing and sales to be more convincing in regard to managing inventory levels when there a data-driven solution that can be referenced for a more rational, goal-driven decision.
Using variables like fulfillment goals (percent of orders you expect to fill), return percentages and the costs of storing, tracking and maintaining them in your facility, a software tool can make this much easier than a spreadsheet. The benefits? Being more accurate on your inventory forecasting and means not only reducing costs in inventory, but the associated costs of the labor for receiving, sorting, stocking, etc. that come with excess inventory, or the labor costs and lost sales that come from too little inventory.
The case study cited by Logistics Management, a wine and spirits wholesaler, reported average inventory reduced by 7-8% and improvements in forecasting with no reduction in actual fulfillment rates.
Returns, RFID and Other Automation
Returns - How do returns matter? Because some portion of your returns will inevitably become part of your inventory again and can be sold again. If you have a 10% return rate (not uncommon in consumer goods businesses with customer-friendly return policies), then this needs to be factored into your planning. If 10% of your products come back (for whatever reason), it will significantly impact your inventory management. One modern-day alternative to dealing with it all yourself and in-house is using a specialist returns vendor like Tradeport, who will take your returns and sell them for you.

RFID – One additional idea we’ve seen and like. If you are working with high-value items RFID may be a better solution for your facility in ways that go far beyond the value in managing your inventory. But when it comes to cycle counts, which are the bane of many facilities where work has to stop or overtime is required to get them done, RFID can eliminate the errors, hassle and almost the entire cost of doing this.
One of our Resellers implemented a solution a couple of years ago that entailed the use of multiple RFID antennae mounted on a telescopic pole, which in turn was mounted one of our own carts which supply the power to the antennae. By rolling the cart down the aisles of the distribution center, cycle counts were completed in just minutes as the readers capture a 100% accurate count of every item stored in shelves on both sides of each aisle.
Consider it Another “Core Business Process”
When you look at the value of any specific business, including perhaps your own, the inventory on-hand is often the second most valuable asset (after the customer database, for those businesses that don’t own property). This demands to put management attention on this space and to acquire the expertise to optimize it. DC management staff or merchandising teams who embrace this as a core skill should be considered valuable.
A modern-day software application, a forecasting methodology, and incorporating best practices in other sub-process areas like returns and cycle counts are all elements of making the most out of your inventory – and giving your customers the service you want them to expect.