Holiday season, or “peak season” as it’s known in the industry, is a part of the annual “rhythm of the business” in the warehouse and logistics industry. In the US, it’s generally seen as encompassing the last four months of the year, and accounts for about 60% of all retail sales for the entire year. So there is never any doubt about the importance, the stress and the rewards involved in planning and executing for success every year.
But as we have said so many times already this year, 2020 IS DIFFERENT.
In 2020, there are thousands of businesses dealing with “peak season” differently this year, and learning new things they didn’t know they needed to learn in February. We’ve covered many of these processes (see a selection here) during the year, and have seen all kinds of successful, and not-so-successful process evolutions.
There are MANY challenges for those focusing on Ecommerce for the first time this year and for those who have had to go from thinking of it as an add-on convenience service to relying on it almost exclusively as their sales channel. One core area to look at during peak season is “How to Measure?” both for those who are new to the experience and for those who are dealing with volumes they’ve never experienced before. Here are five KPIs to watch for the rest of the year – and into January – that you should add to your portfolio of measurements.
1. The 2019 KPIs
The best place to start is with your own history. Go back a year and look at what you measured, and what the data shows you. You should have a LOT to work with. For example, how many calls/emails/order did you get every day? If you break them out by day of the week, you should be able to use that to forecast this year as well in regards to schedule labor and shipping by day of the week. The percentages for each day generally stay consistent.
Or your “run rate” for orders connected to a specific email or catalog. The response curve will develop a pattern you can use to forecast – orders, shipments, staffing, inventory, and more Ecommerce has shortened these cycles massively, which is why your favorite retailers are dropping emails into your Inbox every day, or even two-three times a day. A typical paper catalog from the pre-internet world would have a 12-16 week tail for receiving orders. But even they are lucky to be viable even beyond two weeks now.
2. Fulfillment Rate
 Fulfillment Rate is a VERY important KPI that is directly connected to your customer satisfaction levels, no matter which way you measure it. This is very logical because if you think about the process a customer goes through before ordering something, then the importance of having it ready to ship is mission-critical to generating repeat business.
- Research online
- Compare prices
- Compare shipping times and shipping fees
- Order product
- Get notified product is NOT available, or backordered beyond acceptability
- Lose customer
Fulfillment rate should be measured at different levels – one for the entire business over time or media (by day, week, month, email, catalog, etc.) – and others for individual products or SKUs. Grouping by manufacturer can also be a way to measure performance for suppliers. Poor fulfillment rates could suggest a reliability issue with a supplier if it is connected to delayed shipments, etc.
3. Average Backorder Days Out
For some reason, accurate backorder information is still problematic for many businesses. The reason this is problematic is that 1) without it you can’t make any promises beyond what you have on hand, which will hurt your fulfillment rate and 2) it’s really not that hard given traditional catalog businesses already had this figured out even before the internet age.
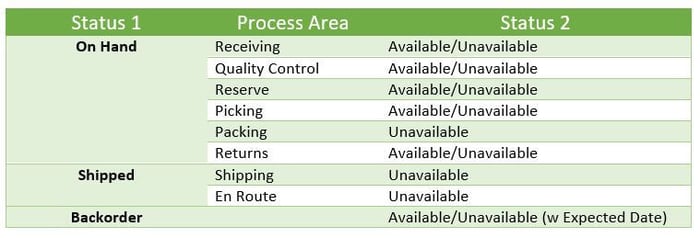
Being accurate about this is basically about creating and managing a set of statuses. The table below is just one example, but the key thing is to make sure the math is set up right to debit SKU counts as their availability changes. i.e. Once something is ordered online, it goes from “Available” to “Unavailable” but is still considered “On Hand”, meaning it is still in the warehouse. You can also set your Backorder item availability to allow for only those arriving in 14 or 30 days to be “Available”. This allows you to maximize your sales of product not yet in stock while also leaving out others where the arrival date may still be in question.
Knowing “Average Backorder Days Out” means giving crystal clear information online or on the phone to customers, increasing the likelihood of getting the order. It’s a bit like the difference between a busy signal and hold music. Customers getting the former are less likely to call back than they would be willing to wait.
4. Return Rate
 Finally, keeping an eye on your Return Rate is more important in this season than ever. Return rates are impacted by a number of factors, and can vary anywhere from 2-3% up to 50% (i.e. women’s swimwear).
How the return rate varies over time, by product, etc. can be a signal for something else going on in the business – picking/packing errors, slow shipping, product quality. Having a generous return policy is one way to make sure you can take advantage of the flaws that returns can expose. The other upside to a generous return policy is that it forces you to improve on the flaws it finds, because accepting and processing excessive returns can get very expensive.
What’s Your Number?
What KPIs take on more prominence for you doing this time of year? We’d love to hear more about the numbers or the processes that are the most stressed trying to keep up with the crush in a regular year and anything that has changed this year.